


Tracking iPhone Memory Leaks
Update: Sept 21, 2010
I just got back from the FITC Mobile conference in Toronto where I gave a talk on “Finding and Fixing Memory Leaks in iOS Apps”. The full presentation and code examples I demonstrated are now available on this blog post: Presentation: Finding & Fixing Mem Leaks (opens in new window/tab)
Original Tutorial:
I’ve been using Instruments a lot lately as I approach the end of my game development cycle. I’ve found it especially useful for tracking down memory leaks in my game. I figured that since I found Instruments so helpful, it might be helpful for other people to get a quick introduction on how to use it to track mem leaks.
What is a memory leak and why should I care?
A memory leak is when your program loses track of a piece of memory that was allocated. The consequence is that the “leaked” memory will never be freed by the program. This usually happens when a piece of code does a “new” or a “malloc” (or an “alloc” in Objective-C) but never does a corresponding “delete”, “free” or “release”, respectively.
When you new, malloc, or alloc, what the Operating System is doing is giving your program a chunk of memory on the heap. The OS is saying, “here, have this block of memory at this memory address.” It expects you to hold a reference to that memory address (usually in the form of a pointer) and it’s relying on you to tell the OS when you’re done with it (by calling free, delete, or release).
Memory leaks happen when you throw away your pointer to that memory. If your program no longer knows where on the heap your memory is allocated, how can you ever free it?
So why should you care? In the most minor case, you’re wasting memory that will be freed when the user quits your app. In the worst case, you could have a memory leak that happens every frame. That’s a good way to end up crashing your program, especially if a user lets it run for a long time. (Note: in iOS you can’t leak system-wide memory. In the worst-case you will cause your app to run out of memory and crash, but you can’t bring the whole system down).
For more general information on memory leaks, have a look at wikipedia for a start:
http://en.wikipedia.org/wiki/Memory_leak
How do I know I’ve got a memory leak?
Some memory leaks are easy to see by looking at your code. Some are much more difficult. This is where Instruments comes in. Instruments has a “Leaks” tool that will tell you exactly where you’re leaking memory so that you can get in there and fix it!
An Example App
I’ve created an example application that leaks memory in two places. The code is as follows (note: I’ve wrapped some strings so that they show up in the space available on the site, this code won’t compile unless you fix that if you copy it into XCode):
InstrumentsTestViewController.h
//
//  InstrumentsTestViewController.h
//  InstrumentsTest
//
//  Created by Owen Goss on 01/02/09.
//  Copyright Streaming Colour Studios 2009. All rights reserved.
//

#import <UIKit/UIKit.h>

@interface InstrumentsTestViewController : UIViewController {
    NSString* mMyLeakyString;
}

@end
InstrumentsTestViewController.mm
//
//  InstrumentsTestViewController.mm
//  InstrumentsTest
//
//  Created by Owen Goss on 01/02/09.
//  Copyright Streaming Colour Studios 2009. All rights reserved.
//

#import "InstrumentsTestViewController.h"
#import "LeakyClass.h"

@interface InstrumentsTestViewController ()
- (void) doSomethingNow;
@end

@implementation InstrumentsTestViewController

// Implement viewDidLoad to do additional setup after loading the
// view, typically from a nib.
- (void)viewDidLoad {
    [super viewDidLoad];

    LeakyClass* myLeakyInstance = new LeakyClass();
    delete myLeakyInstance;

    mMyLeakyString = [[NSString alloc] initWithUTF8String:"I'm a
                     leaky string."];

    [self doSomethingNow];
}

- (void)dealloc {
    [super dealloc];

    [mMyLeakyString release];
}

- (void) doSomethingNow
{
    mMyLeakyString = [[NSString alloc] initWithUTF8String:"Look,
                     another alloc, but no release for first one!"];
}
LeakyClass.h
//
//  LeakyClass.h
//  InstrumentsTest
//
//  Created by Owen Goss on 01/02/09.
//  Copyright 2009 Streaming Colour Studios. All rights reserved.
//

// Forward declaration
class LeakedObject;

class LeakyClass
{
public: // methods
    // Constructor
    LeakyClass();

    // Destructor
    ~LeakyClass();

private: // data
    LeakedObject* mLeakedObject;
};
LeakyClass.mm
//
//  LeakyClass.mm
//  InstrumentsTest
//
//  Created by Owen Goss on 01/02/09.
//  Copyright 2009 Streaming Colour Studios. All rights reserved.
//

#include "LeakyClass.h"
#include "LeakedObject.h"

// Constructor
LeakyClass::LeakyClass()
{
    mLeakedObject = new LeakedObject();
}

// Destructor
LeakyClass::~LeakyClass()
{
}
And there’s a LeakedObject class, but the code isn’t relevant to the example. I’m going to go ahead a build my InstrumentsTest iPhone app in Debug and get it running on my iPhone. Once I’ve done that, I’ll boot up Instruments (typing “Instruments” into Spotlight should find it).
Instruments
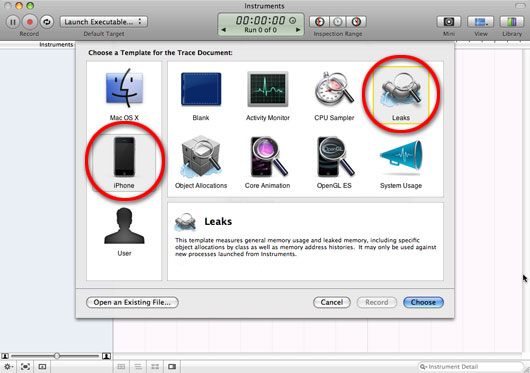
When you launch Instruments, you should be given the chance to select from a variety of different Instrument tools to use. On the left-hand side, choose iPhone. On the right-hand menu, double-click the “Leaks” tool:
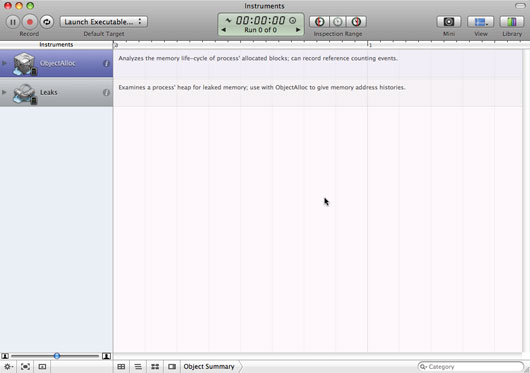
Once you’ve done that, you should see a window that looks like this:
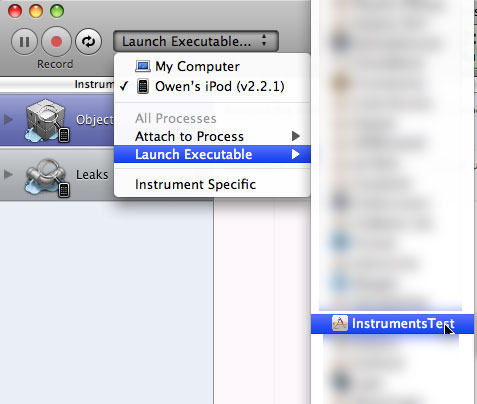
Make sure your iPhone is still connected to your computer. In the top-left corner of the window you’ll see a drop-down menu that says “Launch Executable”. Click on that and make sure that your iPhone (not your computer) is selected as the active device. Then scroll down to “Launch Executable” and you should see a list of all the apps that are installed on your iPhone. Find the app that you want to run “Leaks” on (in this case, InstrumentsTest) and click it.
You’re now ready to go. Click on the red “Record” button:
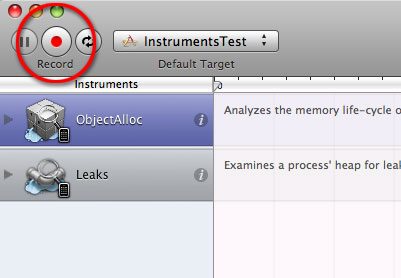
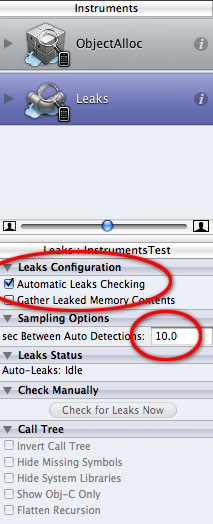
and it will launch your application for you and start recording every memory allocation you do. It will also automatically check for leaks every 10 seconds. You can change how often the automatic leak check runs, or you can set it to run only when you tell it too (when it checks for leaks, the entire app will freeze for about 3-5 seconds, so it can be annoying if you’re trying to play test and check for leaks at the same time). What I usually do is set it to manual control, and then hit the “Check for leaks” button whenever I need to (e.g. after loading a new game mode, after quitting the game back to the main menu, etc). However, for this example, I’m going to leave it on auto:
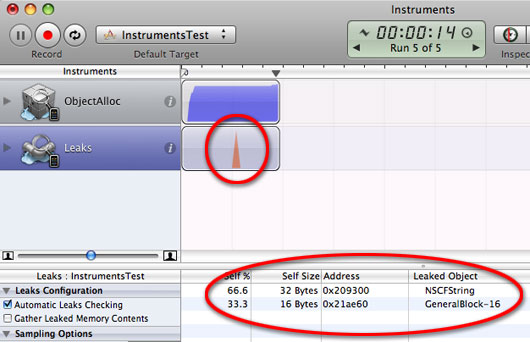
After the app has run for a few seconds, the auto leak check will run and lo and behold, it has found two memory leaks! Fantastic! What do we do now?
Extended Detail View
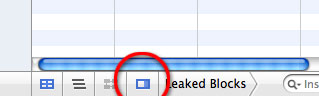
Instruments is very sneaky: it doesn’t make it obvious what to do next. What you need to notice is that row of buttons along the bottom of the window. See that little one made up of two rectangles? Hover your mouse over it and it will say “Extended Detail View”. (Note: You can also open this via View -> Extended Detail)
Update (2010-09-21) – In newer versions of Xcode, the buttons along the bottom have been removed. Click the “Right Pane” icon button at the top of the window to get the Extended Detail View. It is also still available under the View menu.
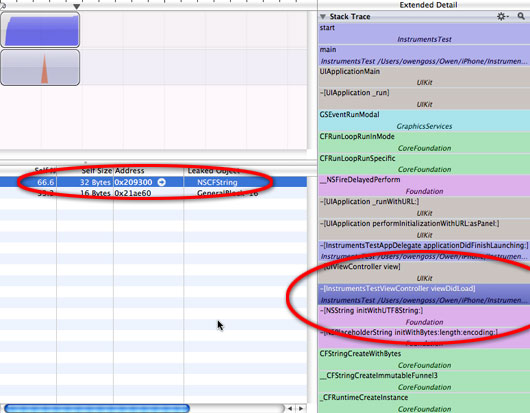
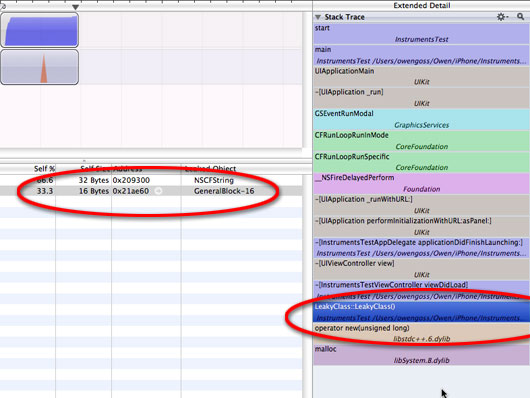
Click that button and a window opens up on the right-hand side of the screen that provides all kinds of handy details about your leaks!
Click on one of the memory leaks. The Extended Detail View will show you a complete stack trace to the point where your leaked memory was allocated. In our example above, clicking on the first leak reveals that a leak occurred inside [NSString initWithUTF8String]. If you look one step higher in the stack trace, you’ll see the last call inside my app was to [InstrumentsTestViewController viewDidLoad].
Here’s the really cool part, double-click on that line in the Extend Detail View and it opens an XCode window right to the culprit!
Update (2010-09-21) – Newer versions of Xcode will display the method name where the leak was allocated right in the main leaks view. You can double-click the leak (without having to open the Extended Details) to see the line of code that leaked. Of course, the Extended Details View is still there in case you want the full stack trace.
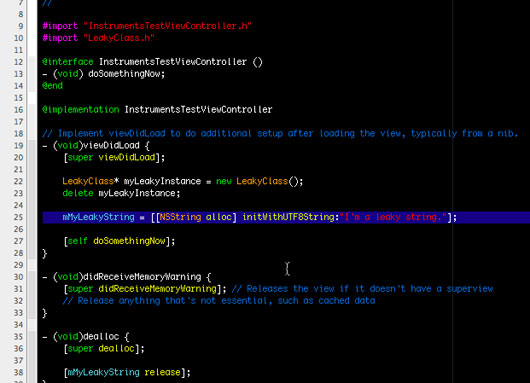
In this case we see that it was the first NSString allocation that leaked. Here’s where you need to do a bit of detective work. This is an extremely simple case, but it can get more tricky to find out why something’s leaky. Let’s take a closer look at our example.
In viewDidLoad we allocate some memory for the string, like this:
    mMyLeakyString = [[NSString alloc] initWithUTF8String:"I'm a
                     leaky string."];
And in dealloc, we release it like this:
[mMyLeakyString release];
So your immediate reaction might be that there shouldn’t be a leak. However, let’s search the code for all references to mMyLeakyString. That turns up this line inside doSomethingNow:
    mMyLeakyString = [[NSString alloc] initWithUTF8String:"Look,
                     another alloc, but no release for first one!"];
Notice that we’ve allocated a new string and assigned the pointer to mMyLeakyString. The problem is that we never released mMyLeakyString before it started pointing to something else. So the original string is now floating around on the heap and we have no way of freeing that memory. What the release call inside dealloc is actually doing is freeing the 2nd string that we allocated in doSomethingNow, because that’s where the pointer is pointing.
So, to fix this, we might change doSomethingNow to something like this:
- (void) doSomethingNow
{
    [mMyLeakyString release];
    mMyLeakyString = [[NSString alloc] initWithUTF8String:"Look,
                     another alloc, but released first one!"];
}
What this does is release the first string we allocated before we point mMyLeakyString to our new string. When you build and run your app in Instruments again, you’ll see there’s one fewer memory leak. Of course, there are probably some better ways to handle NSStrings in your project, but if you had to do it this way, this would fix it.
Let’s take a look at that second leak. Clicking on it again reveals the callstack of what led to the leak. Finding the last call inside our app shows that the leak came from inside the LeakyClass::LeakyClass() constructor:
Double-click that in the stack and it opens up the culprit in XCode again:

Here we see the constructor does a new of a LeakedObject. But what’s this? The destructor never deletes the pointer? Well that’s no good! For every new, there needs to be a corresponding delete! So let’s change the destructor to this:
// Destructor
LeakyClass::~LeakyClass()
{
    if (mLeakedObject != NULL)
    {
        delete mLeakedObject;
        mLeakedObject = NULL;
    }
}
Build and run your app through Instruments again and you should be memory leak free!
I’ve chosen these two examples, even though they’re both very simple, because they show that Instruments can be used to track down memory leaks both in your Objective-C objects, as well as your C++ classes that are integrated into your app.
So go forth and fix your memory leaks! Because remember, a mem leak-free app is a happy app!
I hope that you have found this useful. If you have any comments or suggestions for improvement, please leave a comment below.
Owen